How to give developers safe pod-level access in Kubernetes using Portainer
Portainer provides a centrally deployed management platform that allows Operations teams to deliver a controlled, intuitive dashboard to developers.
With the correct access and RBAC roles in place, developers can safely interact with applications running in Kubernetes clusters without needing to use kubectl or understand Kubernetes internals.
This guide walks through the three core capabilities most developers require:
- Viewing pod logs
- Accessing a pod console
- Monitoring pod performance metrics
Prerequisites
Before proceeding, ensure:
- Portainer is deployed and connected to your Kubernetes cluster
- The user is authenticated in Portainer
- The user has been granted access to the relevant cluster
- The appropriate Kubernetes RBAC role has been assigned
1. How to view pod logs
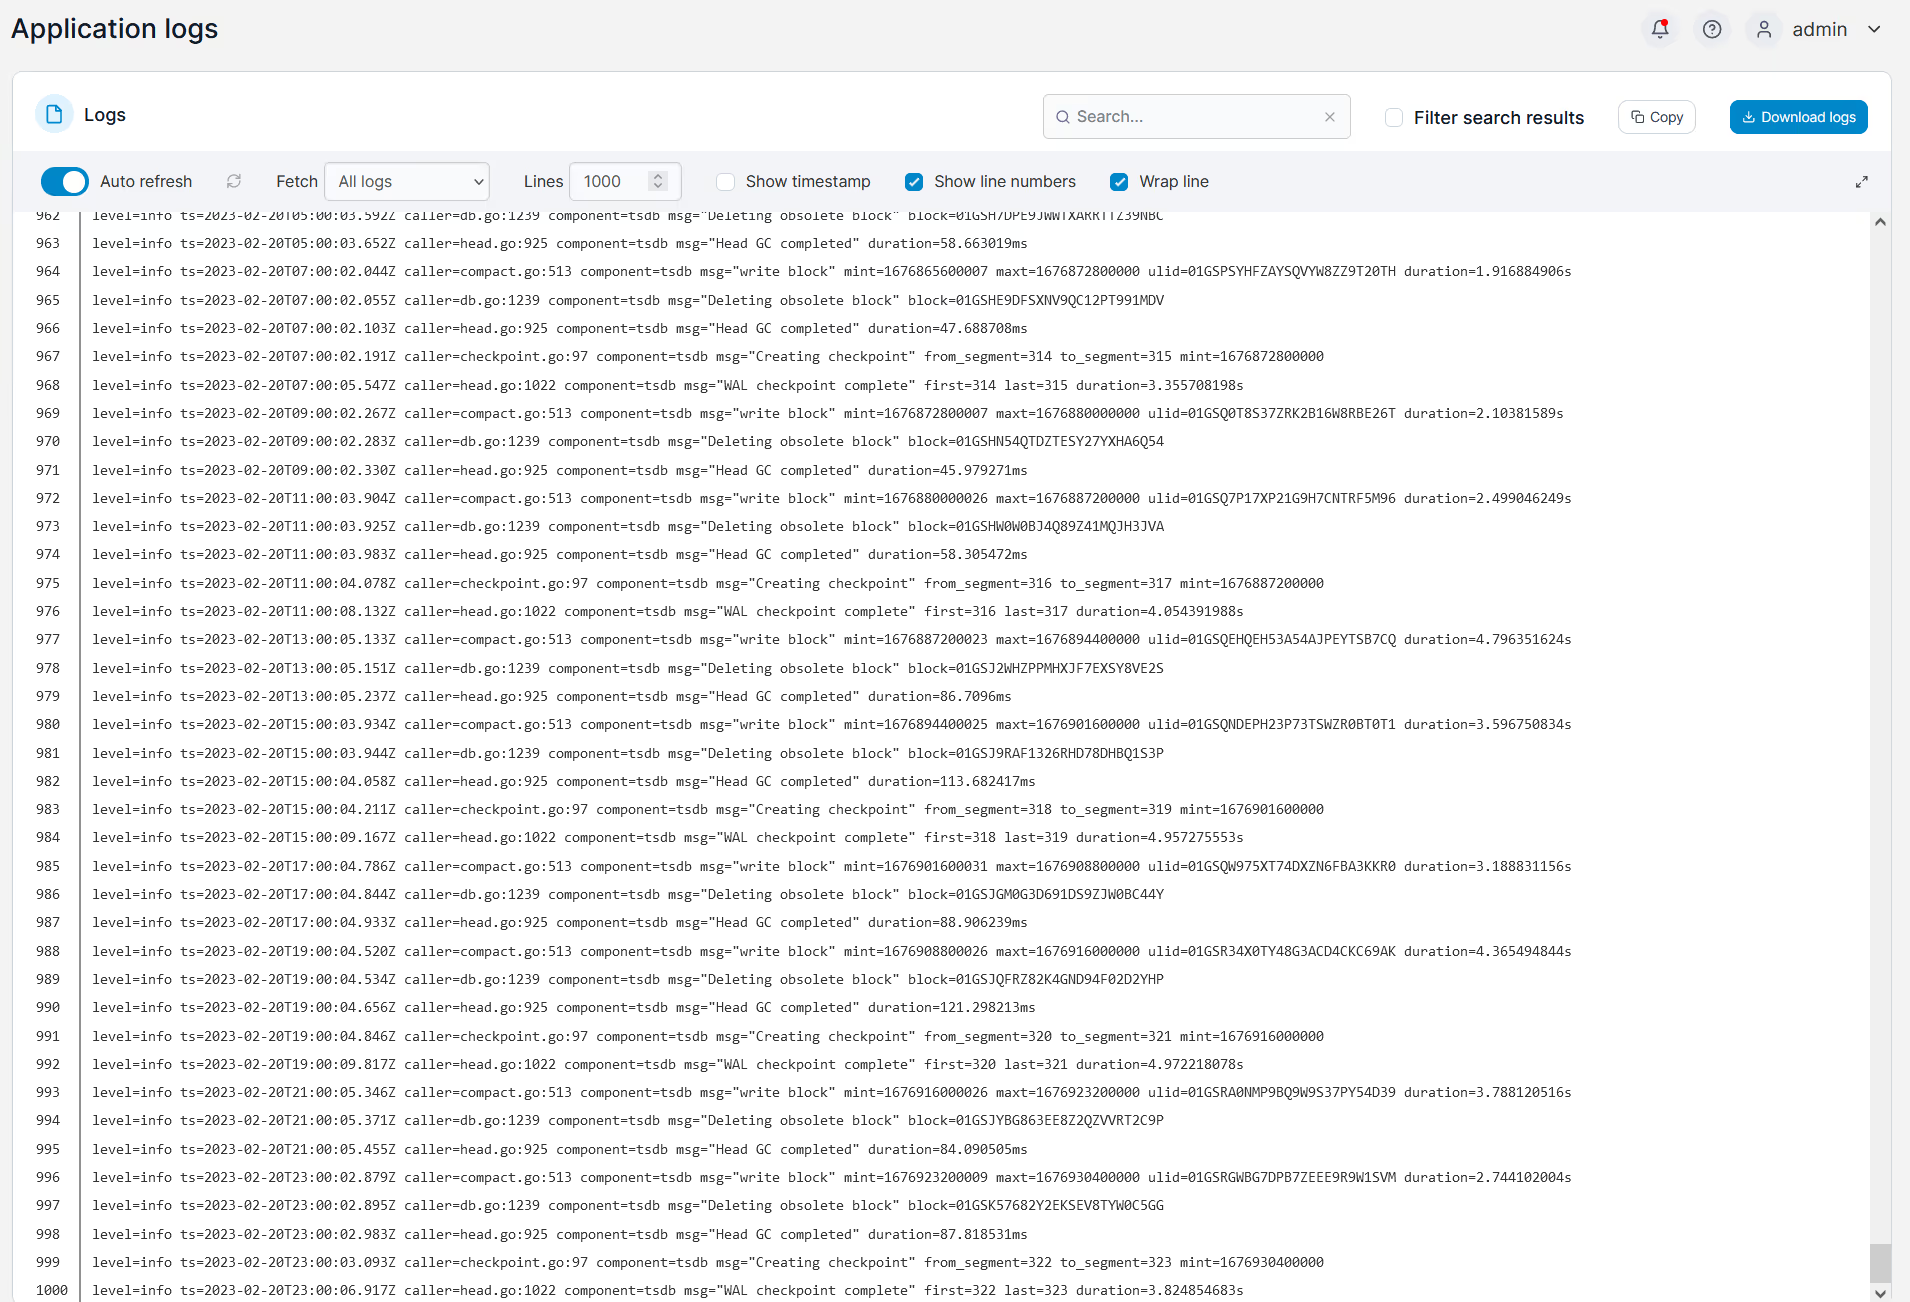
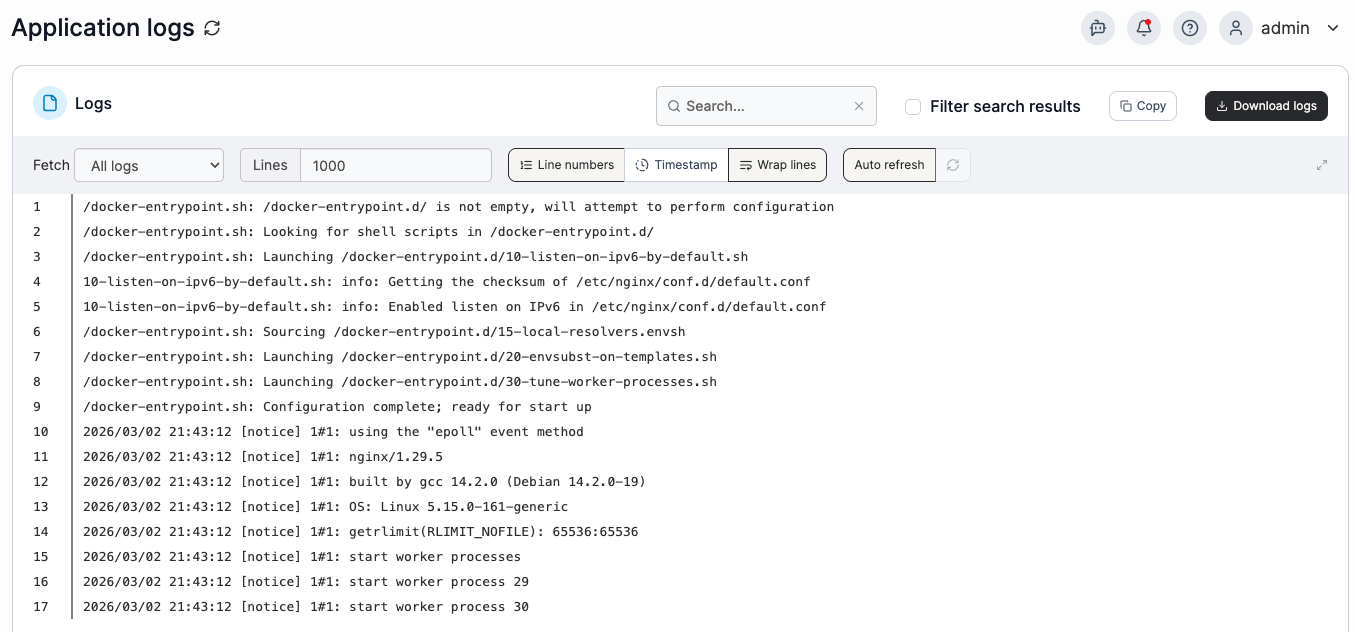
One of the most common troubleshooting tasks is reviewing application logs. In Kubernetes, logs are generated by pods that back your deployments.
Portainer provides direct access to these logs without requiring kubectl.
Steps
- Log in to Portainer
- Select the target Kubernetes environment
- Select Applications in the left hand menu
- Locate the running pod within the Application containers view
- Click Logs from the Actions menu
You are immediately connected to a live stream of the pod logs with:
- Real-time streaming
- Search and filtering
- Time window selection
- Download logs locally
This allows developers to triage issues quickly without CLI access.

2. How to open a console into a running pod
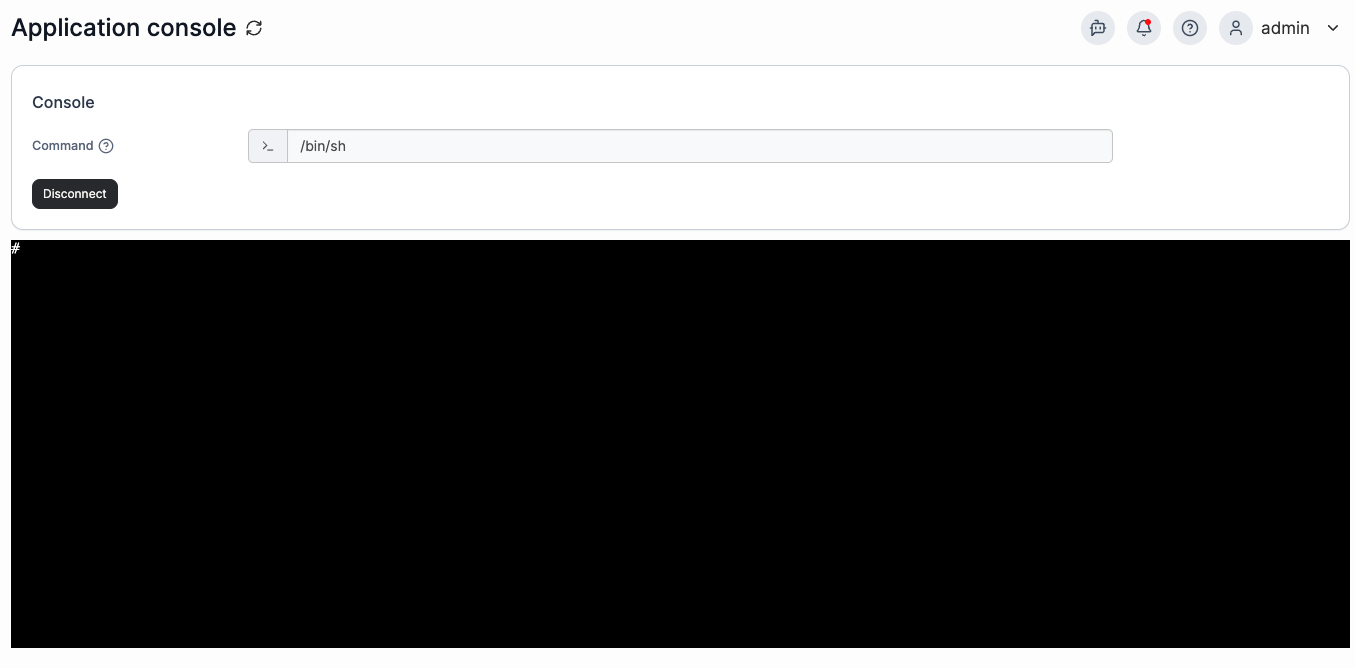
When logs are not enough, developers may need shell access to inspect runtime behavior or review filesystem contents inside a container.
Portainer provides secure console access directly from the UI.
Steps
- Log in to Portainer
- Select the target Kubernetes environment
- Select Applications in the left hand menu
- Locate the running pod within the Application containers view
- Click Console from the Actions menu
A browser-based shell session opens directly into the container.
3. How to view pod performance metrics
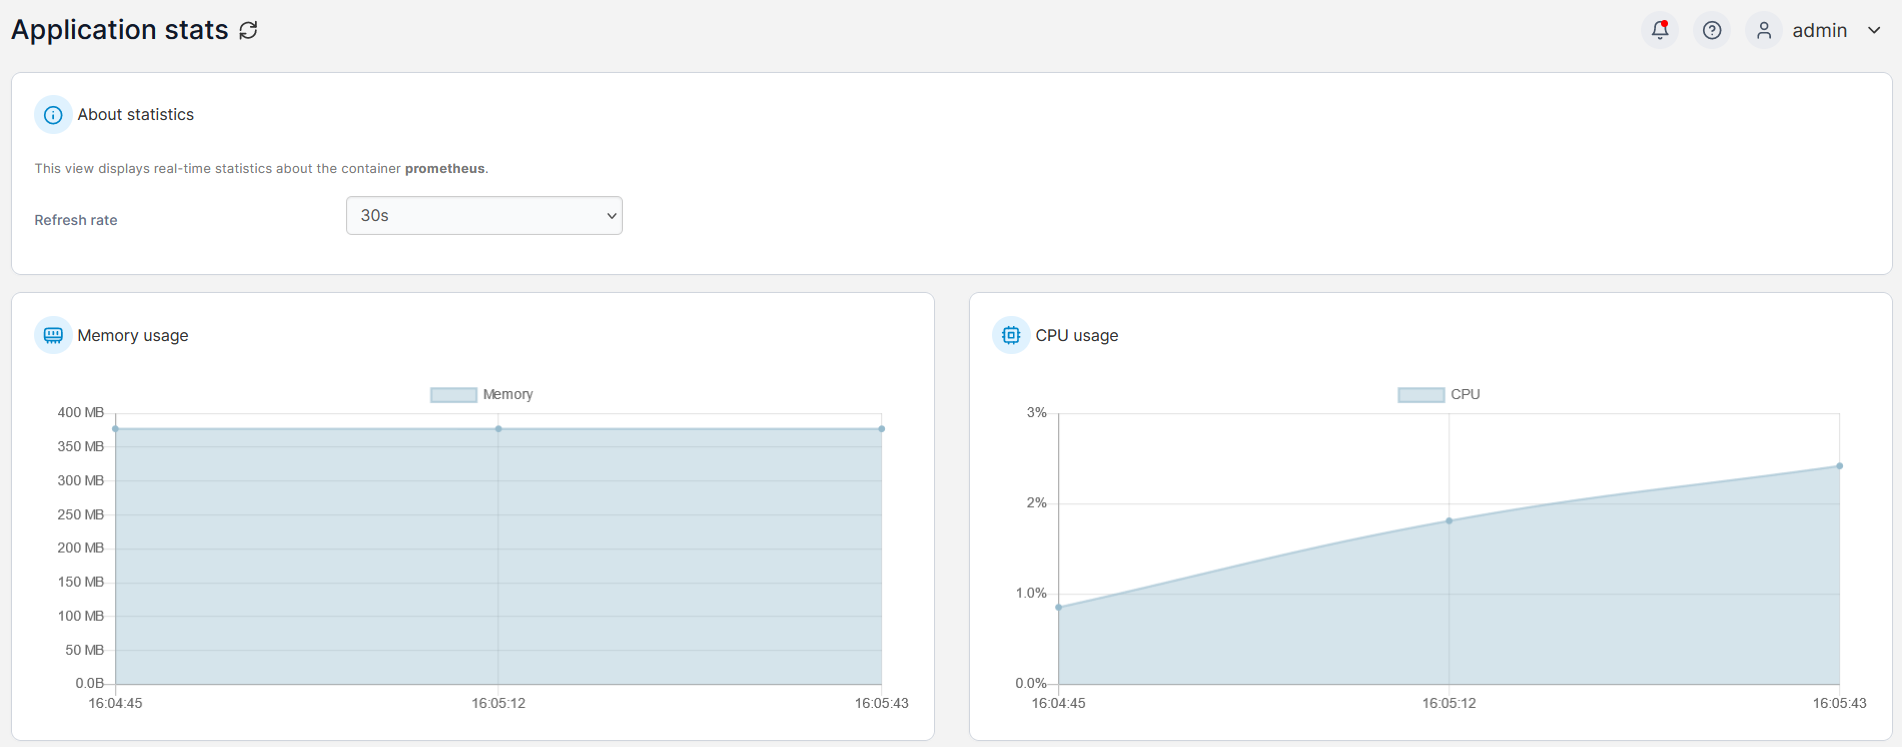
Monitoring CPU and memory usage is critical for diagnosing performance issues.
Portainer integrates with the Kubernetes Metrics API, sourced from:
- Metrics Server
- Prometheus Adapter
Steps
- Log in to Portainer
- Select the target Kubernetes environment
- Select Applications in the left hand menu
- Locate the running pod within the Application containers view
- Click Stats from the Actions menu
You can view real-time CPU and memory usage for the selected pod.
Why this matters
With Portainer installed, Operations teams can provide developers access to:
- Logs
- Console access
- Performance metrics
All without:
- Installing CLI tools
- Providing direct
kubectlaccess - Exposing broader cluster permissions
This model improves security, simplifies workflows, and reduces operational overhead.
Try Portainer with 3 Nodes Free
If you're ready to get started with Portainer Business, 3 nodes free is a great place to begin. If you'd prefer to get in touch with us, we'd love to hear from you!